See your profit and costs at a glance with the Full-Time Baker dashboard
Money coming in is not the same as money kept. A busy month of orders can still leave you with very little once ingredients, packaging, delivery and your own time are taken out. The Full-Time Baker plan puts the numbers that matter in one place, so you can see how your baking business is really doing.
Profit and costs, front and centre
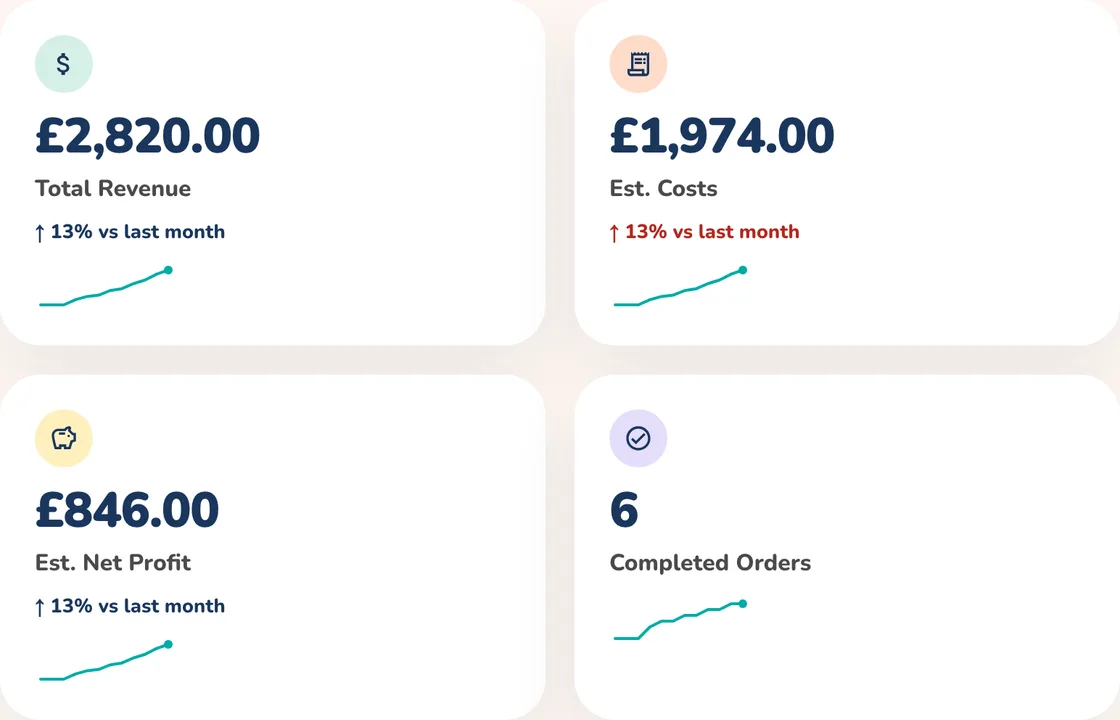
Open the Dashboard and the cards across the top answer the question every baker asks: am I actually making money?
- Total Revenue: everything your completed orders have brought in
- Est. Costs: the estimated cost of making and delivering those orders, taken from your recipe and order calculations
- Est. Net Profit: what is left once the estimated costs are taken away from your revenue
- Completed Orders: how many orders you have finished, with a comparison against last month
Watch the trend, not just the total
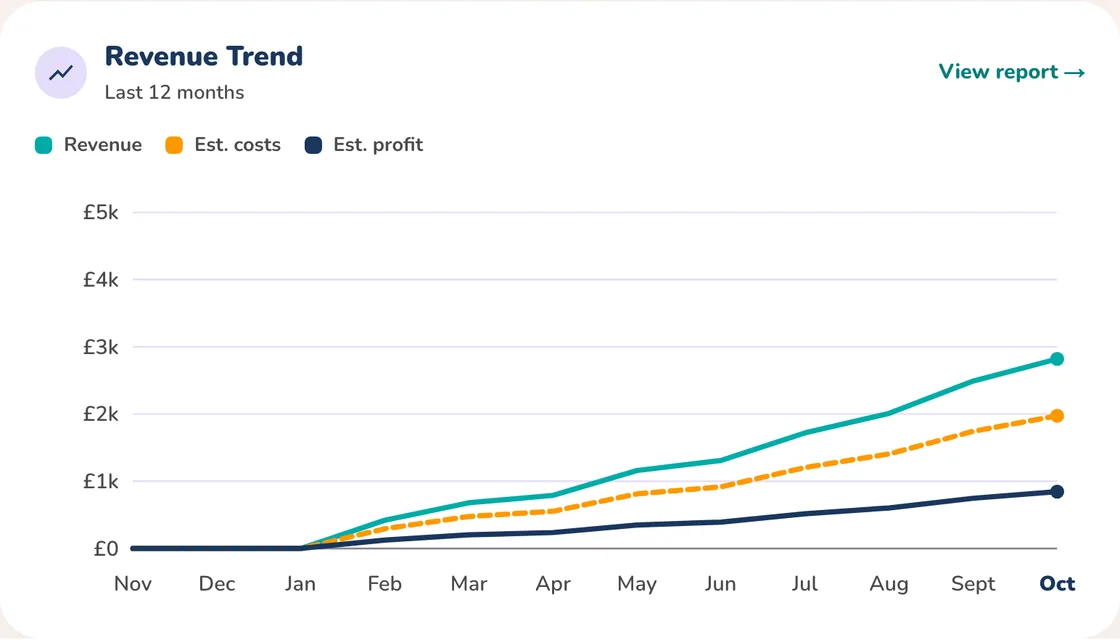
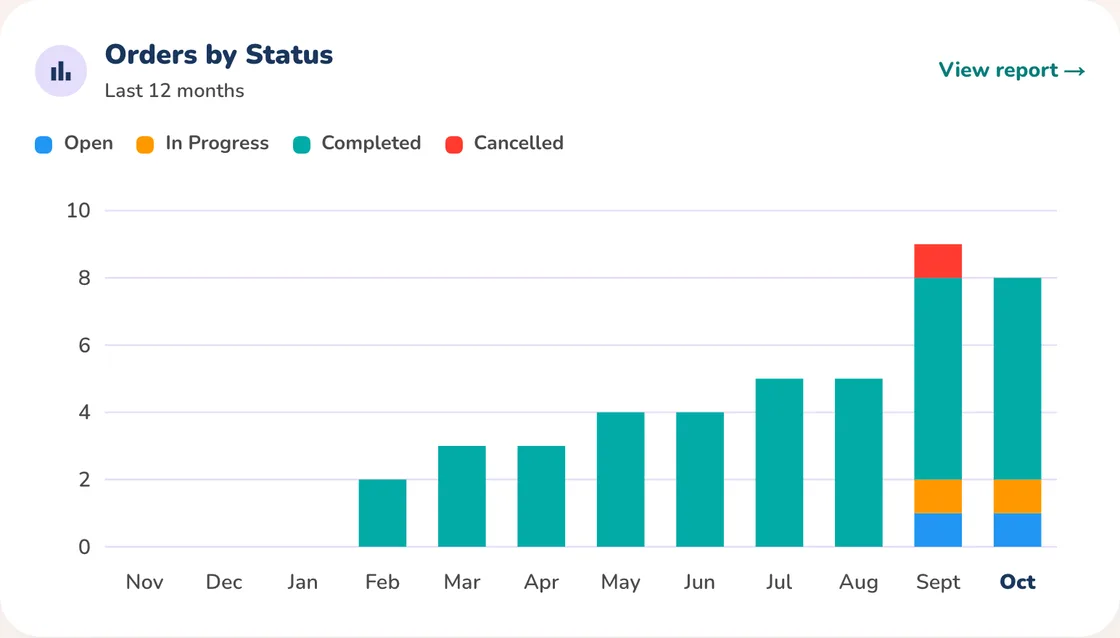
The Revenue Trend chart plots revenue, estimated costs and estimated profit over the last 12 months, so you can spot your busy seasons and see whether costs are creeping up faster than sales. Next to it, Orders by Status shows how many orders are open, in progress, completed or cancelled.
- Revenue, estimated costs and estimated profit side by side for every period
- A Monthly Breakdown of your orders by status, with their total value
- An at-a-glance comparison with last month on your key figures
Go deeper with the Business Report
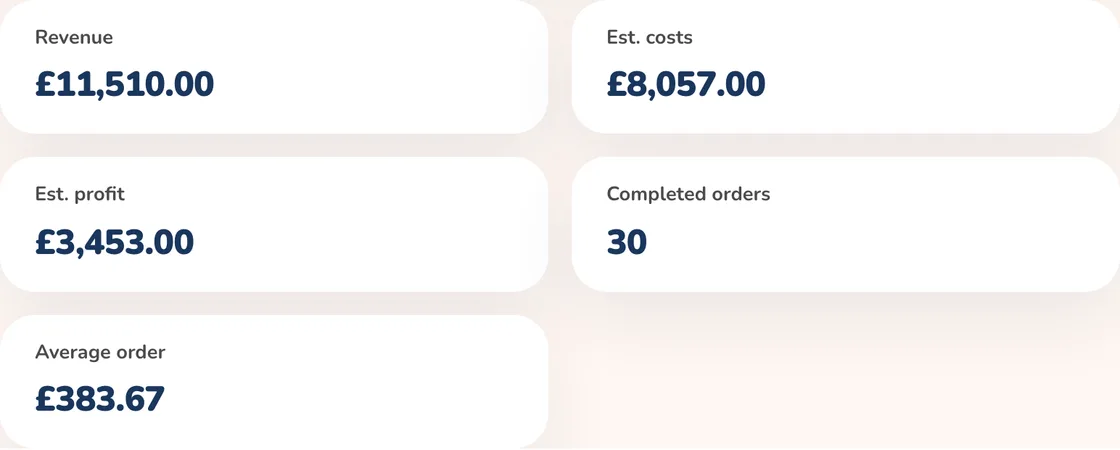
Select View report on the dashboard to open the full Business Report. Choose the period you want to look at, group the figures by day, week or month, and the summary updates with revenue, estimated costs, estimated profit, completed orders and your average order value.
- Ready-made periods: this month, last 3 months, last 6 months, last 12 months or this year
- A custom date range for any period you want to review, such as a wedding season or a quarter
- Group by day, week or month to see the detail or the big picture
- Filter by order status, or search by customer, cake or recipe
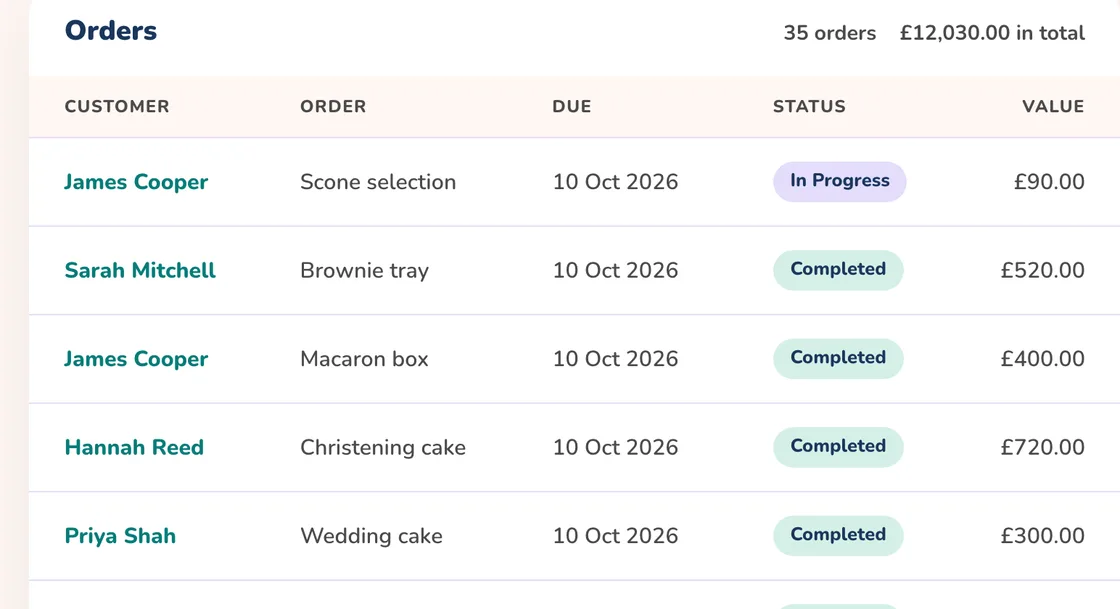
- A full list of the orders behind the figures, with their due date and value
Take your numbers with you in the mobile app
The Glowing Constellation App brings the same reporting to your phone, so you can check your profit between bakes, at a market stall or on the way to a delivery.
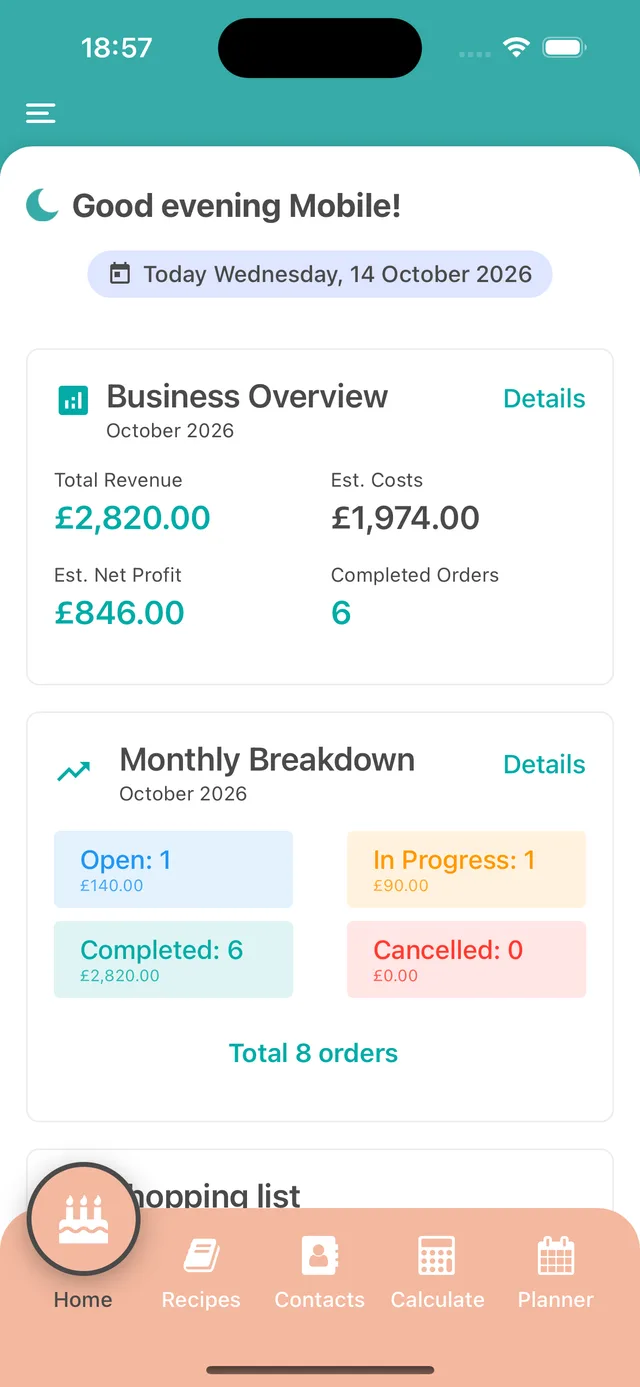
The Home tab opens on your Business Overview for the current month: Total Revenue, Est. Costs, Est. Net Profit and Completed Orders. One glance tells you whether this month is paying off.
Right below it, the Monthly Breakdown shows this month’s orders by status, with the value of each, so you can see what is still to bake and what is already earning.
Business Analytics: profit and costs for any period
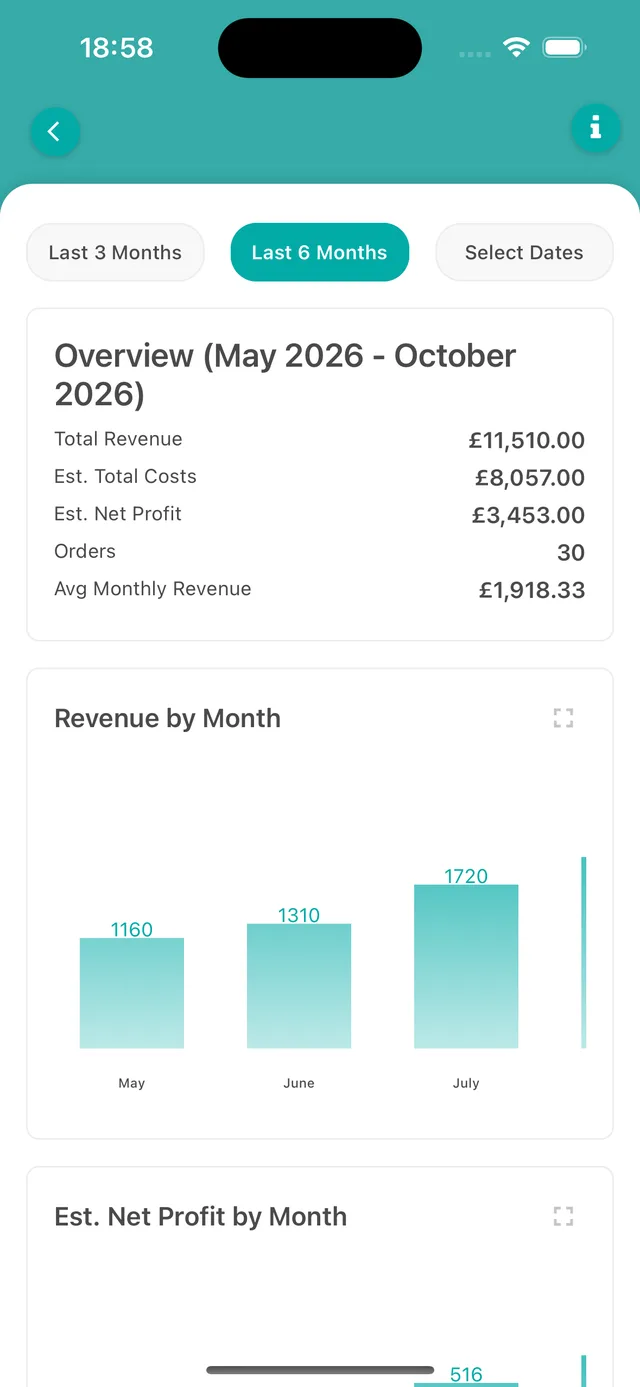
Open the menu at the top left, choose Business Management, then Business Analytics. Choose Last 3 Months, Last 6 Months or Select Dates to see revenue, estimated costs, estimated net profit, orders and average monthly revenue for exactly the period you want.
These business tools are part of the Full-Time Baker plan.
Charts that show profit and costs over time
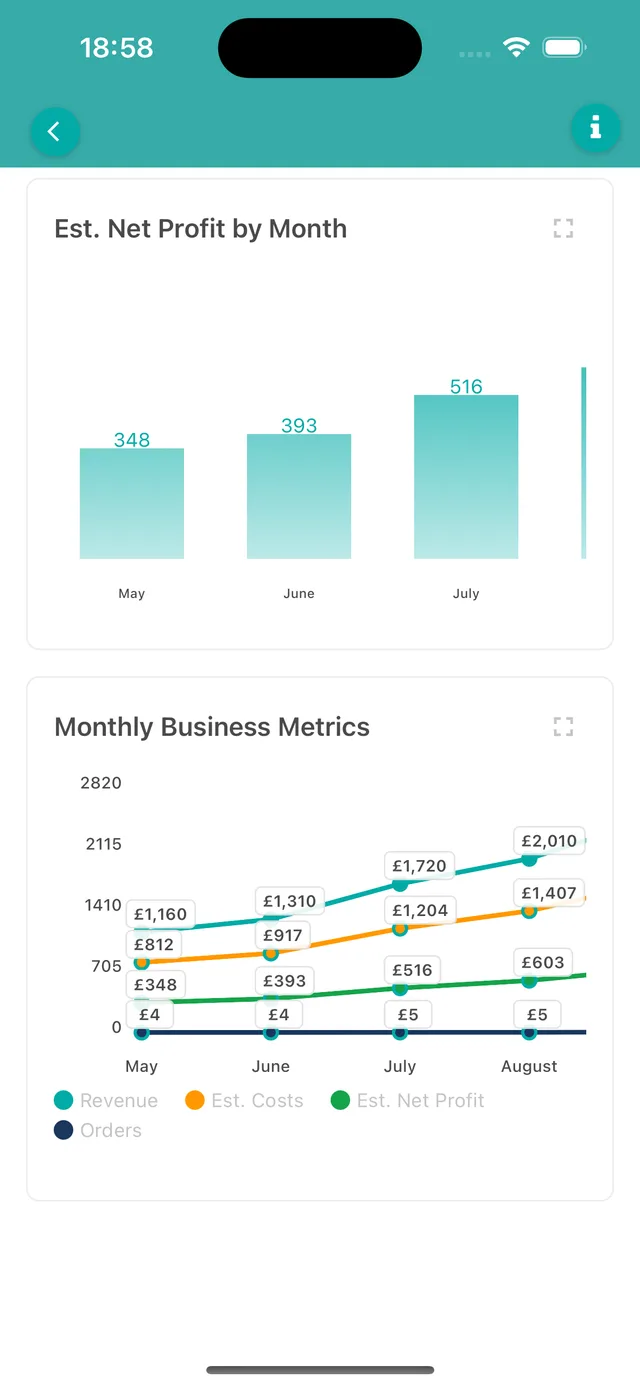
Scroll down for Revenue by Month, Est. Net Profit by Month and Monthly Business Metrics, which plots revenue, estimated costs and estimated net profit together. You can see profit and costs moving over time, and spot the months when costs start to eat into a good result.
Why it pays to keep costs visible
Costs are estimated from the calculations you save with your orders, so the more complete your recipes and pricing are, the more accurate your profit figure becomes. Keep the status of each order up to date, because the dashboard counts completed orders. With the numbers in front of you, it is easier to spot which bakes earn their keep, when to adjust a price and how much you can afford to invest in the business.
Available on the Full-Time Baker plan
The dashboard and reporting tools are part of the Full-Time Baker plan, on the web and in the mobile app, and your data stays in sync across iOS, Android and the web. Our step-by-step guide shows you where to find everything.